
Ethereum extended its upward move this week, climbing more than 5% and briefly pushing above the $2,250 level. The latest Ethereum price prediction shows strengthening bullish momentum, though signs of short-term exhaustion are beginning to emerge.
The move comes as broader crypto markets stabilize, with Bitcoin also holding key support levels and supporting sentiment across major digital assets.
Breakout Structure Fuels Short-Term Momentum
Ethereum’s recent rally was supported by a technical breakout on lower timeframes.
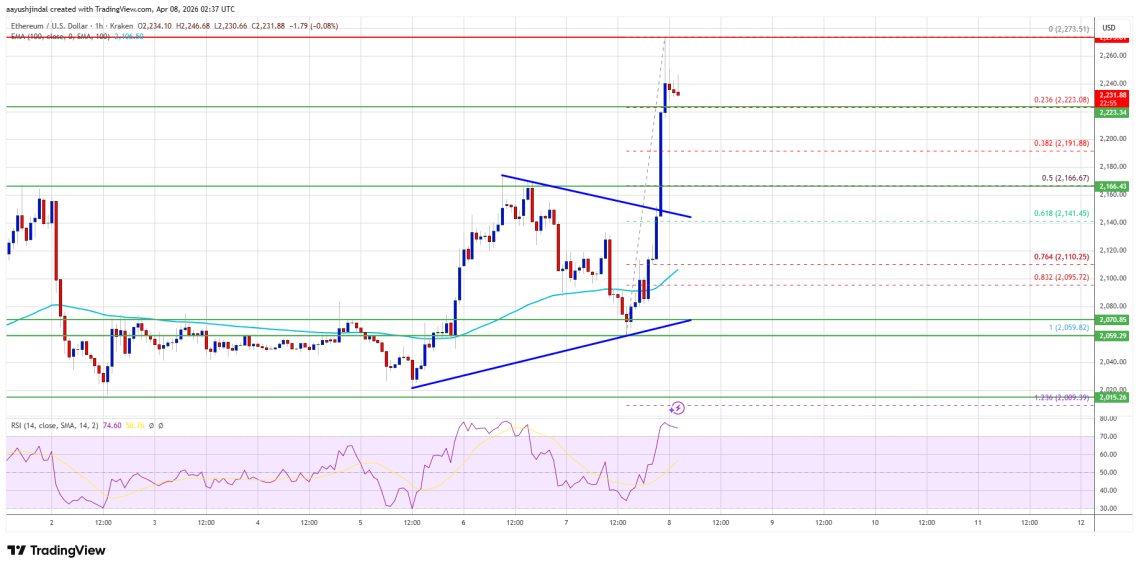
Price moved above the $2,180 and $2,220 resistance levels before breaking out of a contracting triangle pattern near $2,150 on the ETH/USD hourly chart, based on data from Kraken.
This breakout pushed ETH to a local high of $2,273, confirming short-term bullish control before the market entered a mild correction phase.
Price Holds Above Key Moving Average
Despite the pullback, Ethereum continues to trade above $2,200 and the 100-hour Simple Moving Average—levels often associated with short-term trend strength.
The price has retraced toward the 23.6% Fibonacci level of the move from $2,059 to $2,273, indicating a relatively shallow correction so far.
As long as ETH holds above the $2,165 zone, the structure suggests that buyers are still attempting to maintain upward pressure.
Resistance Levels Define Next Upside Attempt
Ethereum now faces a series of resistance levels that could shape near-term price action.
The immediate barrier sits near $2,250, followed by stronger resistance at $2,275 and $2,320. A sustained move beyond these levels would indicate renewed momentum, potentially opening the path toward higher zones.
However, repeated rejections in this range could reinforce consolidation, particularly if trading volume does not expand alongside price.
Downside Risk Remains if Momentum Fades
While the broader structure remains constructive, downside risks are still present.
Initial support is located near $2,220, with a more critical level at $2,165—aligned with the 50% Fibonacci retracement of the recent upward move. A break below this zone could expose lower support areas near $2,120 and $2,110.
The main structural support remains near $2,065, marking the base of the recent rally.
Indicators Show Mixed Momentum Signals
Technical indicators reflect a market in transition.
The Moving Average Convergence Divergence (MACD) is beginning to lose strength within bullish territory, suggesting that upward momentum may be slowing. Meanwhile, the Relative Strength Index (RSI) remains above 50, indicating that buyers still retain some control.
This combination points to a market that is stabilizing after a strong move rather than entering a clear reversal.
Market Psychology: Momentum Meets Caution
Ethereum’s recent price action highlights a familiar dynamic in crypto markets.
Breakouts tend to attract momentum traders, but sustained moves require consistent participation and volume. The current setup suggests that while bullish sentiment has improved, conviction remains limited.
Traders appear to be testing higher levels cautiously, rather than aggressively chasing the move.
What Comes Next for Ethereum
Ethereum’s next phase will likely depend on how it reacts around the $2,250–$2,320 resistance zone.
Holding above key support levels could allow for another attempt higher, while a failure to maintain momentum may lead to extended consolidation or a deeper retracement.
Broader market conditions, including Bitcoin’s stability, will also play a role in shaping ETH’s direction.
Analytical
This Ethereum price prediction reflects a market transitioning from breakout momentum into consolidation. While the recent rally signals improving sentiment, resistance levels remain a key barrier to sustained upside.
The balance between support, stability, and resistance pressure will determine whether Ethereum can extend gains or continue trading within a defined range.
Disclaimer: The information in this article is provided for informational and editorial purposes only and does not constitute financial, investment, trading, or legal advice. You should not rely on this content as a recommendation to buy, sell, or hold any cryptocurrency or other asset. Always conduct your own research and, if necessary, consult a qualified financial advisor before making investment decisions. CoinToria Media and its authors are not responsible for any loss or damage resulting from the use of this information.


